Note
Go to the end to download the full example code
Manipulation of UV-Vis data
After you’ve looked at the simple UV-Vis example, this one shows how you can manipulate UV-Vis data.
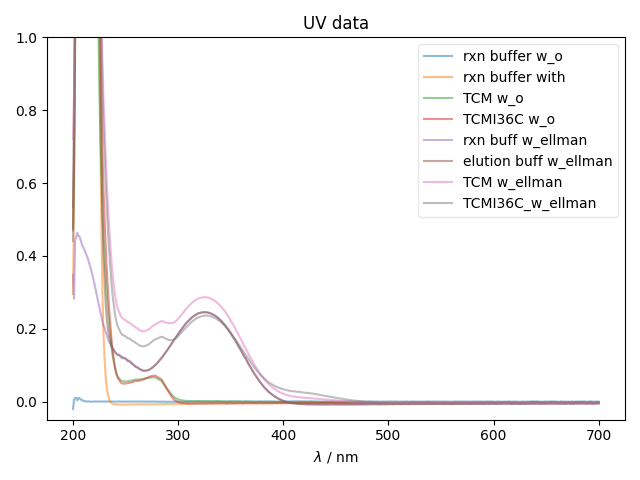
the experiments present in this file are: dict_keys(['rxn buffer w_o', 'rxn buffer with', 'TCM w_o', 'TCMI36C w_o', 'rxn buff w_ellman', 'elution buff w_ellman', 'TCM w_ellman', 'TCMI36C_w_ellman'])
now I'm going to try a DSW file
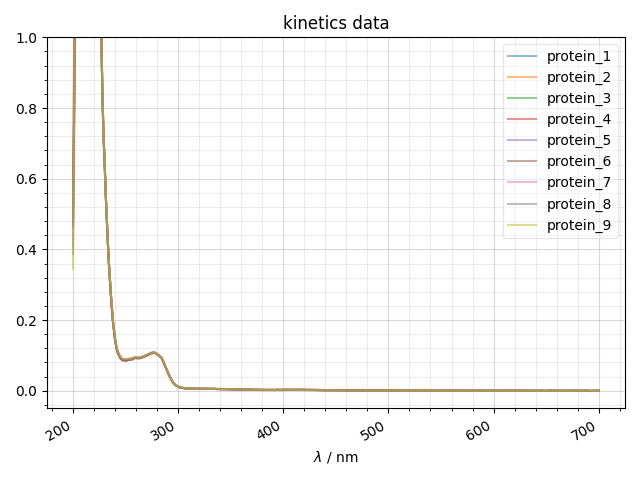
the experiments present in this file are: dict_keys(['protein_1', 'protein_2', 'protein_3', 'protein_4', 'protein_5', 'protein_6', 'protein_7', 'protein_8', 'protein_9'])
1: UV data |||nm
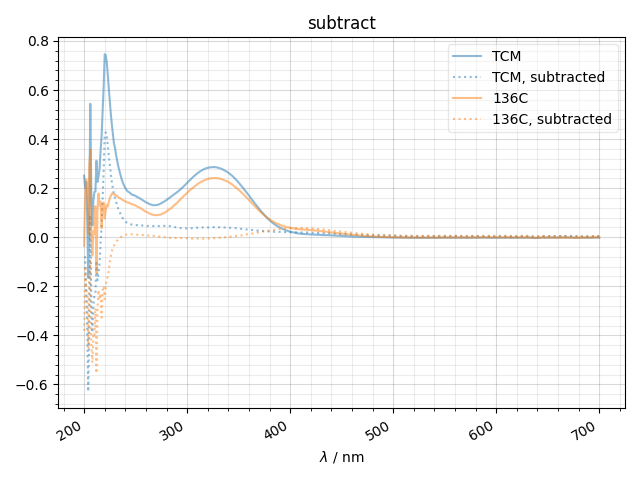
2: subtract |||nm
3: kinetics data |||nm
from pylab import *
from pyspecdata import *
from itertools import cycle
color_cycle = cycle(['#1f77b4', '#ff7f0e', '#2ca02c',
    '#d62728', '#9467bd', '#8c564b', '#e377c2',
    '#7f7f7f', '#bcbd22', '#17becf'])
#init_logging('debug')
data = find_file('200703_Ellman_before_SL.DSW',
    exp_type='UV_Vis/Ellmans_Assay')
print("the experiments present in this file are:",data.keys())
with figlist_var() as fl:
    fl.next("UV data")
    for k,thisspectrum in data.items():
        fl.plot(thisspectrum,
                alpha=0.5,
                label=k)
    ylabel(thisspectrum.get_units())
    ylim((-0.05,1))
    fl.next('subtract')
    subdata = {'TCM':data['TCM w_ellman'] - data['TCM w_o'],
            '136C':data['TCMI36C_w_ellman'] - data['TCMI36C w_o'],
            }
    for k,d in subdata.items():
        thiscolor = next(color_cycle)
        fl.plot(d,
                alpha=0.5,
                color=thiscolor,
                label=k)
        fl.plot(d - data['rxn buff w_ellman'],
                ':',
                alpha=0.5,
                color=thiscolor,
                label='%s, subtracted'%k)
    ylabel(d.get_units())
    gridandtick(gca())
    print("now I'm going to try a DSW file")
    data = find_file('Ras_Stability4',
            exp_type='UV_Vis/Ras_stability/200803_RT')
    print("the experiments present in this file are:",data.keys())
    fl.next("kinetics data")
    for k,thisspectrum in data.items():
        fl.plot(thisspectrum,
                alpha=0.5,
                label=k)
    ylabel(thisspectrum.get_units())
    ylim((-0.05,1))
    gridandtick(gca())
Total running time of the script: (0 minutes 2.648 seconds)


