Note
Go to the end to download the full example code
Bruker cw ESR Data
Load cw Bruker ESR data, both 1D and 2D.
Check out the Simple UV example to understand how pySpecData locates the file here.
import matplotlib.pyplot as plt
import pyspecdata as psd
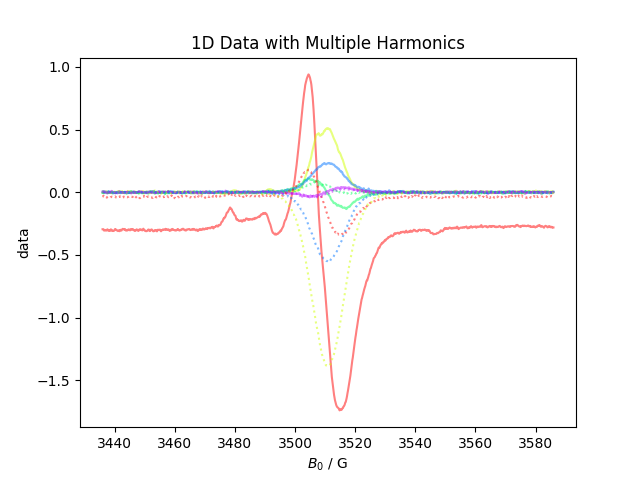
Load some 1D ESR data with harmonic + phase info. The data is initial organized into two dimensions – harmonic and $B_0$.
d = psd.find_file("S175R1a.*DHPC.*200304",
        exp_type='francklab_esr/Sam')
print(d.shape)
print("here, we see the harmonic axis contains both harmonic and phase info",repr(d.getaxis('harmonic')))
d.chunk_auto('harmonic','phase')
[(2048, '$B_0$'), (10, 'harmonic')]
here, we see the harmonic axis contains both harmonic and phase info array([(1,  0), (1, 90), (2,  0), (2, 90), (3,  0), (3, 90), (4,  0),
       (4, 90), (5,  0), (5, 90)],
      dtype=[('harmonic', '<i8'), ('phase', '<i8')])

array([[[-2.94546828e-01, -3.68288604e-02],
        [-3.08371764e-03,  6.13238812e-03],
        [-4.49149462e-03,  7.18220516e-03],
        [ 6.73636716e-04, -2.11555613e-03],
        [ 6.88192341e-03,  5.08947960e-03]],

       [[-2.94215753e-01, -3.57182955e-02],
        [-3.51026174e-03,  4.29212270e-03],
        [-4.31634015e-03,  8.39053228e-03],
        [ 2.66558776e-04, -2.56135657e-03],
        [ 7.00552768e-03,  5.10833628e-03]],

       [[-2.94953691e-01, -3.34736934e-02],
        [-2.56422486e-03,  1.12643511e-03],
        [-2.53831179e-03,  8.33304986e-03],
        [ 6.55038547e-04, -2.93743236e-03],
        [ 5.11506815e-03,  6.28893360e-03]],

       ...,

       [[-2.80658800e-01, -3.28446011e-02],
        [ 4.01519075e-03, -2.80185439e-03],
        [ 1.54833082e-03,  4.65094659e-03],
        [ 5.32599721e-03, -8.04821331e-03],
        [-5.21515998e-03, -1.34590515e-03]],

       [[-2.80400928e-01, -3.25151160e-02],
        [ 2.18324464e-03, -9.15192415e-04],
        [-1.20783223e-04,  6.36937529e-03],
        [ 5.44008378e-03, -9.96095938e-03],
        [-2.31595131e-03, -1.64052881e-03]],

       [[-2.80445226e-01, -2.97726370e-02],
        [ 1.72233837e-03, -9.90763420e-05],
        [-2.16840206e-05,  6.24455227e-03],
        [ 5.35087800e-03, -9.71951497e-03],
        [ 5.82405591e-04, -3.06429791e-03]]], dtype='>f8')
    dimlabels=['$B_0$', 'harmonic', 'phase']
    axes={`$B_0$':array([3436.        , 3436.07324219, 3436.14648438, ..., 3585.78027362,
       3585.85351581, 3585.926758  ])
                    +/-None,
            `harmonic':array([1, 2, 3, 4, 5])
                    +/-None,
            `phase':array([ 0, 90])
                    +/-None}
chunk_auto breaks the harmonic dimensions since it was labeled with an axis that had 2 fields.

[(2048, '$B_0$'), (5, 'harmonic'), (2, 'phase')]

Text(0.5, 1.0, '1D Data with Multiple Harmonics')
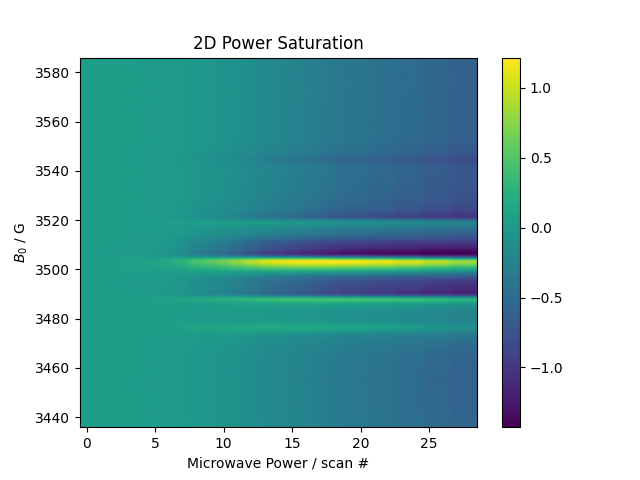
Next, let’s load some power-saturation data
d = psd.find_file("Power.*Sat.*200303",
        exp_type='francklab_esr/Sam')
d.chunk_auto('harmonic','phase')
plt.figure(2)
psd.image(d['harmonic',0]['phase',0].C.setaxis('Microwave Power','#').set_units('Microwave Power','scan #'))
plt.title("2D Power Saturation")
plt.gca().set_aspect('auto')
plt.show()

Total running time of the script: (0 minutes 1.020 seconds)
