Note
Go to the end to download the full example code
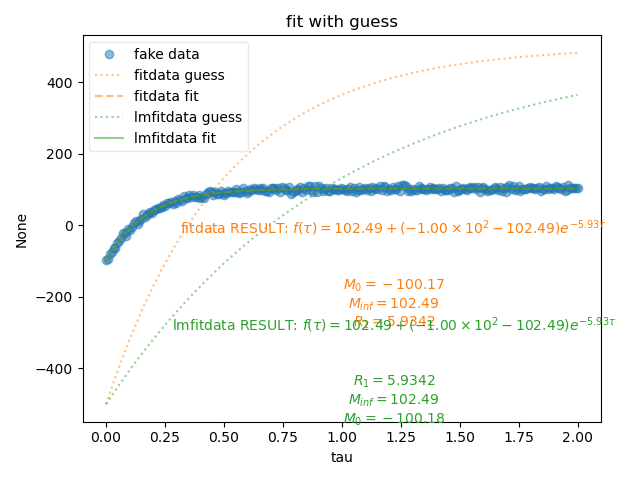
Fitting Data (Nonlinear + Symbolic)
This example creates fake data with noise then fits the exponential with the fitdata function.
{\bf Warning:} You have no error associated with your plot, and I want to flag this for now


----- Results for fitdata: -----
output for fitdata: {'M_0': -101.31178480026007, 'M_inf': 102.28085672058833, 'R_1': 5.980377869772943}
latex for fitdata: $f(\tau)=102.28 + \left(-1.01\times 10^{2} - 102.28\right) e^{- 5.98 \tau}$
$T_1$ for fitdata, 0.1672135142253088
----- Results for lmfitdata: -----
output for lmfitdata: {'M_0': -101.31176496615092, 'M_inf': 102.28085908221091, 'R_1': 5.980376507713949}
latex for lmfitdata: $f(\tau)=(102.28) + \left((-1.01\times 10^{2}) - (102.28)\right) e^{- (5.98) \tau}$
$T_1$ for lmfitdata, 0.16721355230897642
1: fit with guess |||None
import pylab as pl
import pyspecdata as psd
import sympy as sp
from numpy import r_,exp

# {{{ this is the contents of pylab.py -- works
# need to go through and figure out which lines
# are actually needed and which are not
# -- I have already stripped out some


def list_symbs(f):
    # {{{ this is just to show all the parameters
    list_symbs = []
    for j, k in f.output().items():
        s_repr = sp.latex(sp.Symbol(j))
        list_symbs.append(f"${s_repr} = {k:0.5g}$")
    list_symbs = "\n".join(list_symbs)
    # }}}
    return list_symbs


# }}}
# {{{creating a fake data recovery curve
tau = psd.nddata(r_[0:2:256j], "tau")
fake_data = 102 * (1 - 2 * exp(-tau * 6.0))
fake_data.add_noise(5.0)
# }}}
# {{{ define the expression of the functional form once, and then use it
#     for both types of classes
M0, Mi, R1, vd = sp.symbols("M_0 M_inf R_1 tau", real=True)
functional_form = Mi + (M0 - Mi) * sp.exp(-vd * R1)
# }}}
with psd.figlist_var() as fl:
    fl.next("fit with guess")
    fl.plot(fake_data, "o", alpha=0.5, label="fake data")

    def show_guess_and_fit(fitinst, thislabel, x_text, y_text):
        """show the guess and the fit -- group as a function so we're sure we
        do this consistently"""
        fl.next("fit with guess")
        fitinst.settoguess()
        guess_line = fl.plot(
            fitinst.eval(100), ":", alpha=0.5, label=f"{thislabel} guess"
        )
        thiscolor = guess_line[0].get_color()
        fitinst.fit()
        print("-" * 5, f"Results for {thislabel}:", "-" * 5)
        print(f"output for {thislabel}:", fitinst.output())
        print(f"latex for {thislabel}:", fitinst.latex())
        T1 = 1.0 / fitinst.output("R_1")
        print(f"$T_1$ for {thislabel}, {T1}")
        this_ls = "-"
        if thislabel == "fitdata":
            this_ls = "--"
        fl.plot(
            fitinst.eval(100),
            ls=this_ls,
            color=thiscolor,
            alpha=0.5,
            label=f"{thislabel} fit",
        )
        ax = pl.gca()
        pl.text(
            x_text,
            y_text,
            f"{thislabel} RESULT: %s" % fitinst.latex(),
            ha="center",
            va="center",
            color=thiscolor,
            transform=ax.transAxes,
        )
        pl.text(
            x_text,
            y_text,
            (3 * "\n") + list_symbs(fitinst),
            ha="center",
            va="top",
            size=10,
            color=thiscolor,
            transform=ax.transAxes,
        )

    # {{{ use fitdata
    fitdata_instance = psd.fitdata(fake_data)
    fitdata_instance.functional_form = functional_form
    fitdata_instance.set_guess({M0: -500, Mi: 500, R1: 2})
    show_guess_and_fit(fitdata_instance, "fitdata", 0.6, 0.5)
    # }}}
    # {{{ lmfitdata method
    lmfitdata_instance = psd.lmfitdata(fake_data)
    lmfitdata_instance.functional_form = functional_form
    lmfitdata_instance.set_guess(
        M_0=dict(value=-400, max=0, min=-500),
        M_inf=dict(value=400, max=500, min=0),
        R_1=dict(value=1, max=10, min=0),
    )
    show_guess_and_fit(lmfitdata_instance, "lmfitdata", 0.6, 0.25)
    # }}}
Total running time of the script: (0 minutes 0.785 seconds)