Note
Go to the end to download the full example code
PPM in 2D
Show how to_ppm() can apply to two dimensions!
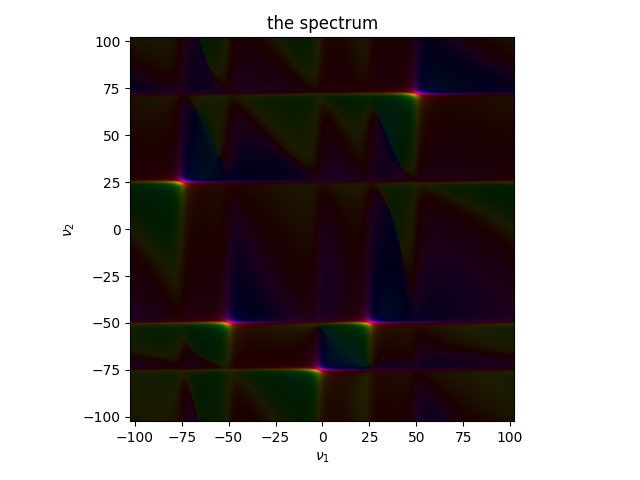
1: the spectrum |||(None, None)
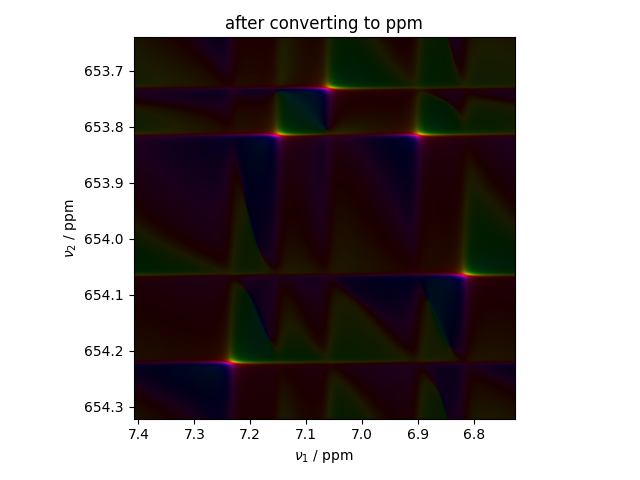
2: after converting to ppm |||('ppm', 'ppm')
from numpy import pi, r_, exp
from pyspecdata import nddata, figlist_var

# make peaks on a frequency axis
x = nddata(r_[0:5:1024j], "t2")
y = nddata(r_[0:5:1024j], "t1")

# generate time-domain signal
signal = 0 * x * y  # create an array of zeros that's the right shape
for nu1, nu2 in [(25, -50), (-50, -50), (-2, -75), (-75, 25), (50, 72)]:
    signal += exp(
        +1j * 2 * pi * nu2 * x - x / 0.2 + 1j * 2 * pi * nu1 * y - y / 0.05
    )
signal.ft("t2", shift=True)
signal.ft("t1", shift=True)

signal.set_prop("acq", {"SFO1": 300.196194352191})
signal.set_prop("proc", {"OFFSET": 7.408084, "SF": 300})

with figlist_var() as fl:
    fl.next("the spectrum")
    fl.image(signal)
    signal.to_ppm("t2")
    signal.to_ppm("t1")
    fl.next("after converting to ppm")
    fl.image(signal)
Total running time of the script: (0 minutes 4.083 seconds)


