Note
Go to the end to download the full example code
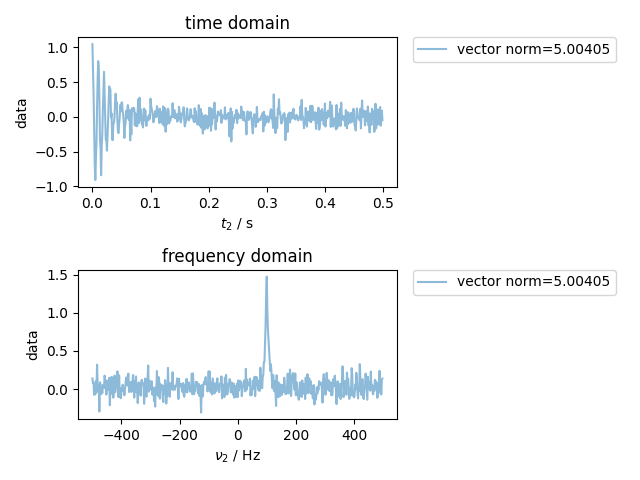
Unitary FT
Demonstrate new argument to ft and ift that allows you to take an FT that’s unitary in the vector sense – this way, you don’t have to e.g. multiply by dt and divide by the number of points. (This is a standard capability with raw numpy, but we just had not much use for it before)
from pylab import *
from pyspecdata import *

fig, (ax_time, ax_freq) = subplots(2, 1)
t = nddata(r_[0:0.5:1e-3], "t2")  # 1 kHz SW with a freq. resolution of 1/0.5=2 Hz
fake_data = exp(1j * 2 * pi * 100 * t - 10 * t * pi)  # 10 Hz wide line at 100 Hz offset
fake_data.add_noise(0.1).set_units("t2", "s")
logger.info(strm("vector norm of fake data, before ft", linalg.norm(fake_data.data)))
plot(
    fake_data,
    ax=ax_time,
    alpha=0.5,
    label="vector norm=%g" % linalg.norm(fake_data.data),
)
ax_time.set_title("time domain")
ax_freq.set_title("frequency domain")
fake_data.ft("t2", shift=True, unitary=True)
logger.info(
    strm("vector norm of fake data, after unitary ft", linalg.norm(fake_data.data))
)
assert fake_data.get_ft_prop("t2", "dt") == 1e-3
plot(
    fake_data,
    ax=ax_freq,
    alpha=0.5,
    label="vector norm=%g" % linalg.norm(fake_data.data),
)
fake_data.ift(
    "t2"
)  # because we already used "unitary" for the ft, it knows the ift is unitary.
#    In fact, passing "unitary" as a keyword argument will generate an error here
logger.info(
    strm("vector norm of fake data, after unitary ift", linalg.norm(fake_data.data))
)
ax_time.legend(**dict(bbox_to_anchor=(1.05, 1), loc=2, borderaxespad=0.0))
ax_freq.legend(**dict(bbox_to_anchor=(1.05, 1), loc=2, borderaxespad=0.0))
fig.tight_layout()
show()
Total running time of the script: (0 minutes 0.591 seconds)