Note
Go to the end to download the full example code
Quantify the Double Integral of an ESR spectra (QESR)
Calculate the concentration of spin label present in a sample based on the double integral of an ESR spectra.
An ESR spectra should be collected for both the sample of interest as well as a “background” (typically water for aqueous samples). The spectra is rescaled according to it’s acquisition parameters (e.g., Q value, diameter of capillaries, modulation amplitude, gain, etc) and multiplied by a proportionality constant that is defined in your pyspecdata config file.
In order to properly run this example, your config file should have the following values under General:
220720new propfactor = 1.715e-10
220720new q = 4600
qesr caps diameter = 0.704
default calibration = 220720new
default diameter = qesr caps
Note that the diameter is given in units of mm.
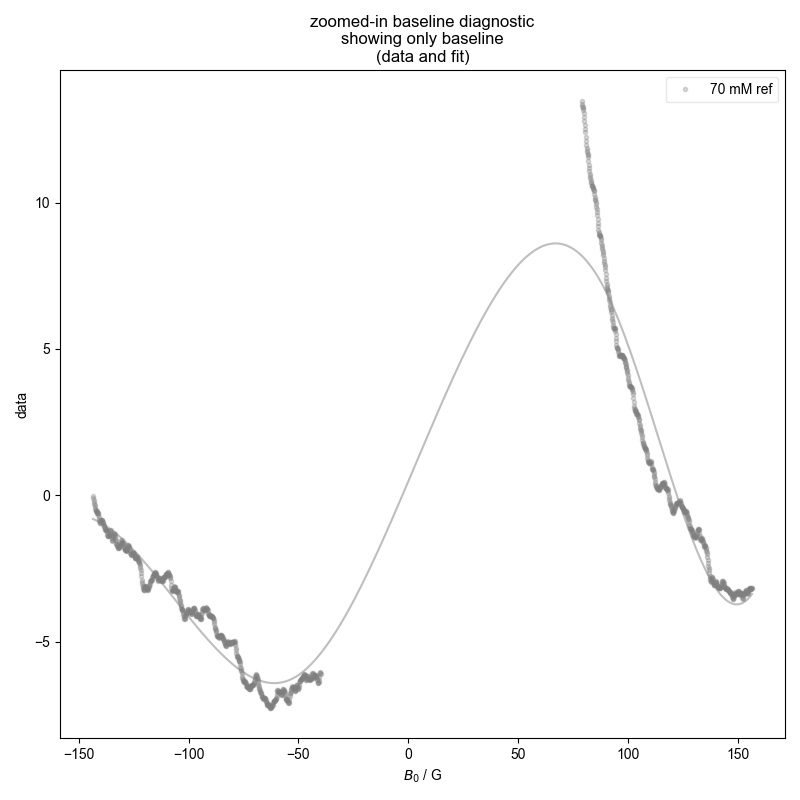
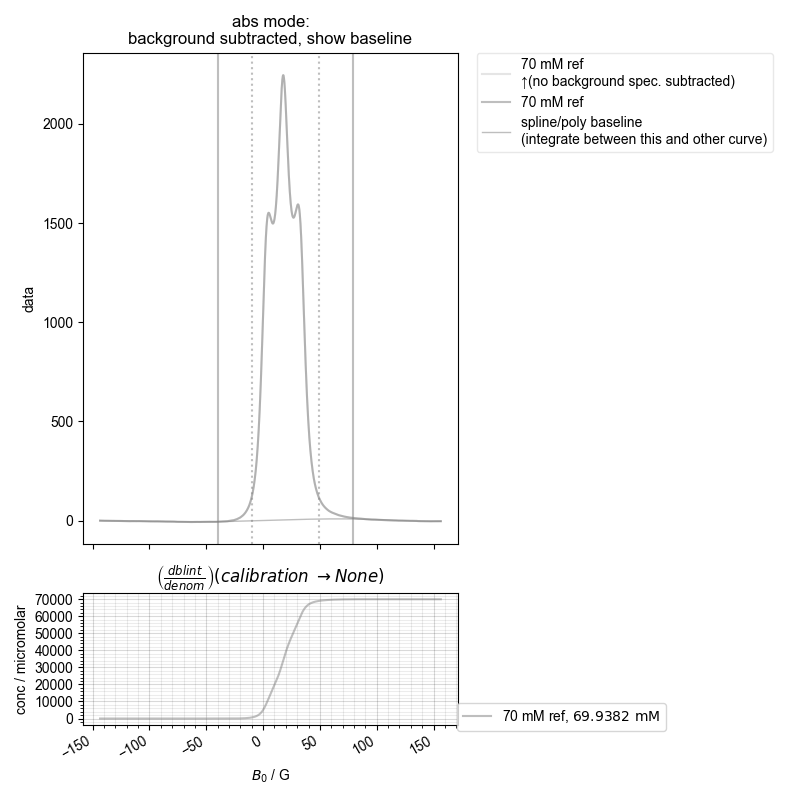
the stored concentration is 69.93816677405941 millimolar
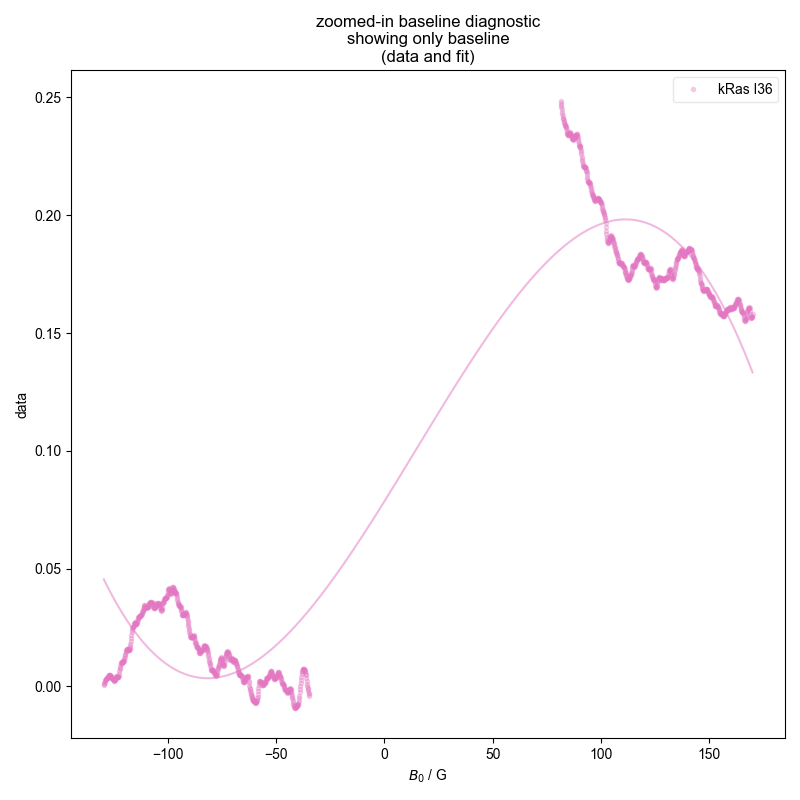
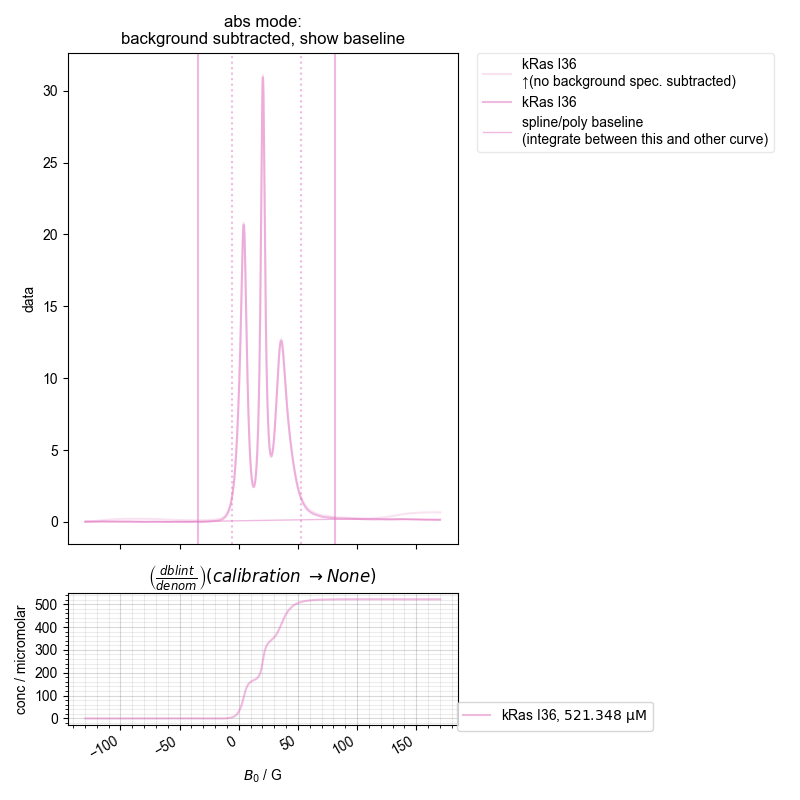
the stored concentration is 521.3475578866337 micromolar
1: ras baseline diagnostic
{'print_string': '\\par'}
{'width': 0.9}
2: ras absorption, bg. no bl. |||G
{'print_string': '\\textbf{\\texttt{220804_rasI36_MTSL.DSC}}\\par'}
{'print_string': '\\par'}
3: calibration experiment baseline diagnostic
{'print_string': '\\par'}
{'width': 0.9}
4: calibration experiment absorption, bg. no bl. |||G
{'print_string': '\\textbf{\\texttt{220720_stock_4.DSC}}\\par'}
{'print_string': '\\par'}
\par
\textbf{\texttt{220804_rasI36_MTSL.DSC}}\par
\par
\par
\textbf{\texttt{220720_stock_4.DSC}}\par
\par
from matplotlib.pyplot import rcParams
from pyspecProcScripts import QESR
from pyspecdata import figlist_var, find_file
import pickle

# sphinx_gallery_thumbnail_number = 2
rcParams["image.aspect"] = "auto"  # needed for sphinx gallery

pickle_file = "TEMPOL_rerun_conc.pickle"  # when complete, the
#                                          concentration is stored here
with figlist_var() as fl:
    fl.basename = "ras"  # I want different basenames so these show up on
    #                      different plots, because they have very
    #                      different concentrations
    c = QESR(
        "220804_rasI36_MTSL.DSC",  # filename
        label="kRas I36",  # label for legends
        exp_type="francklab_esr/Farhana",  # location of file
        diameter_name="QESR caps",
        background=find_file(
            "220804_water.DSC", exp_type="francklab_esr/Farhana"
        )[
            "harmonic", 0
        ],  # background used for background subtraction - loaded above
        pickle_file=pickle_file,
        fl=fl,
    )
    fl.basename = "calibration experiment"
    c = QESR(
        "220720_stock_4.DSC",  # filename
        label="70 mM ref",  # label for legends
        exp_type="francklab_esr/alex",  # location of file
        diameter_name="QESR caps",
        pickle_file=pickle_file,
        fl=fl,
    )
    with open(pickle_file, "rb") as fp:
        pickle_vars = pickle.load(fp)
    print("the stored concentration is", pickle_vars["70 mM ref"])
    print("the stored concentration is", pickle_vars["kRas I36"])
Total running time of the script: (0 minutes 2.328 seconds)