Note
Go to the end to download the full example code
Show data with postproc
py proc_raw_data.py NODENAME FILENAME EXP_TYPE
Fourier transforms (and any needed data corrections for older data) are performed according to the postproc_type attribute of the data node. This script plots the result, as well as signal that’s averaged along the nScans dimension.
Tested with:
py proc_raw.py echo_6 240620_200uM_TEMPOL_pm_echo.h5 ODNP_NMR_comp/Echoes
py proc_raw.py echo_8 240620_200uM_TEMPOL_pm_generic_echo.h5 ODNP_NMR_comp/Echoes
py proc_raw.py CPMG_9 240620_200uM_TEMPOL_pm_generic_CPMG.h5 ODNP_NMR_comp/Echoes
py proc_raw.py field_3 240920_27mM_TEMPOL_debug_field ODNP_NMR_comp/field_dependent
py proc_raw.py ODNP K42.*A1_kRasbatch240814 ODNP_NMR_comp/ODNP
py proc_raw.py FIR_34dBm K42.*A1_kRasbatch240814 ODNP_NMR_comp/ODNP
---------- logging output to /home/jmfranck/pyspecdata.0.log ----------
postproc_type: spincore_SE_v1
=============ACQ PARAMS=============
FIR_rep : 4859435.131433044
SW_kHz : 3.8999532005615936
T1water_cold : 2.17
T1water_hot : 2.98
acq_time_ms : 125.89894666666666
adc_offset : 63
amplitude : 1.0
carrierFreq_MHz : 14.893542624
chemical : 200uM_TEMPOL_pm
concentration : 0.0002
cpmg_counter : 7
date : 240620
deadtime_us : 1000.0
deblank_us : 1.0
echo_acq_ms : 5.128266666666666
echo_counter : 6
field_width : 10.0
gamma_eff_MHz_G : 0.004279844541443734
guessed_MHz_to_GHz : 1.5168
guessed_phalf : 0.3
krho_cold : 260.0
krho_hot : 380.0
max_power : 2.51
nEchoes : 25
nScans : 1
num_T1s : 5
p90_us : 3.1
power_steps : 5
repetition_us : 20000000.0
startconstant : 0.15
stopconstant : 2.0
tau_us : 3564.1333333333328
thermal_nScans : 1
type : echo
uw_dip_center_GHz : 9.819055
uw_dip_width_GHz : 0.008
====================================
1: raw data
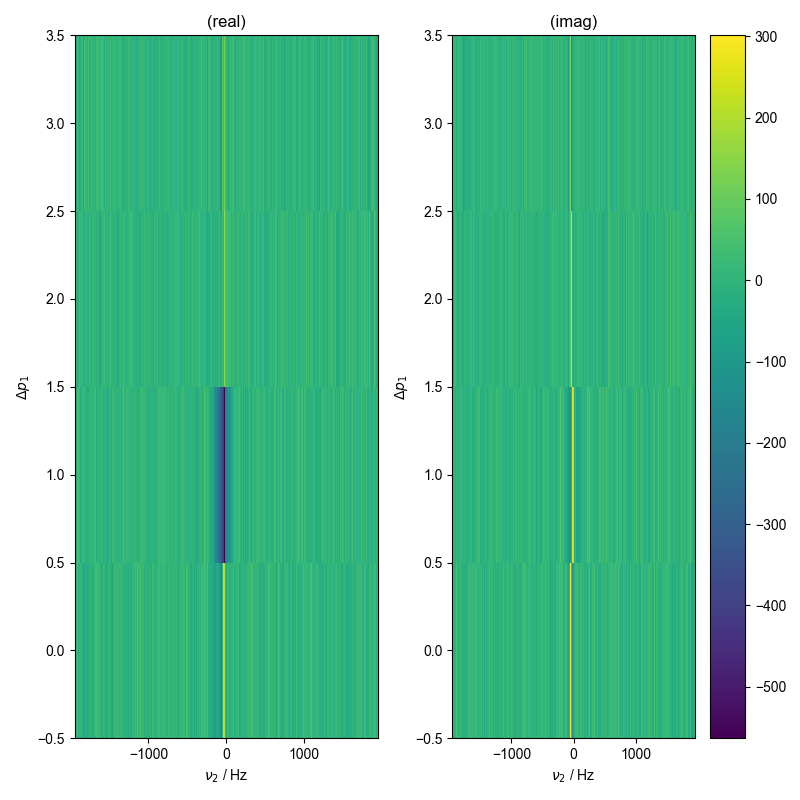
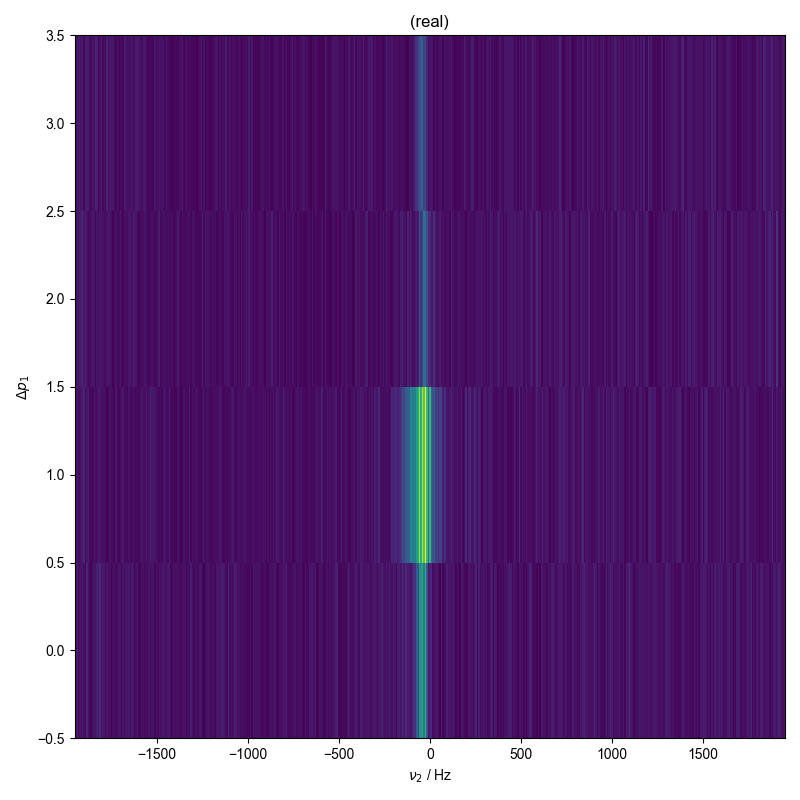
2: sum of abs of all coherence pathways (for comparison)
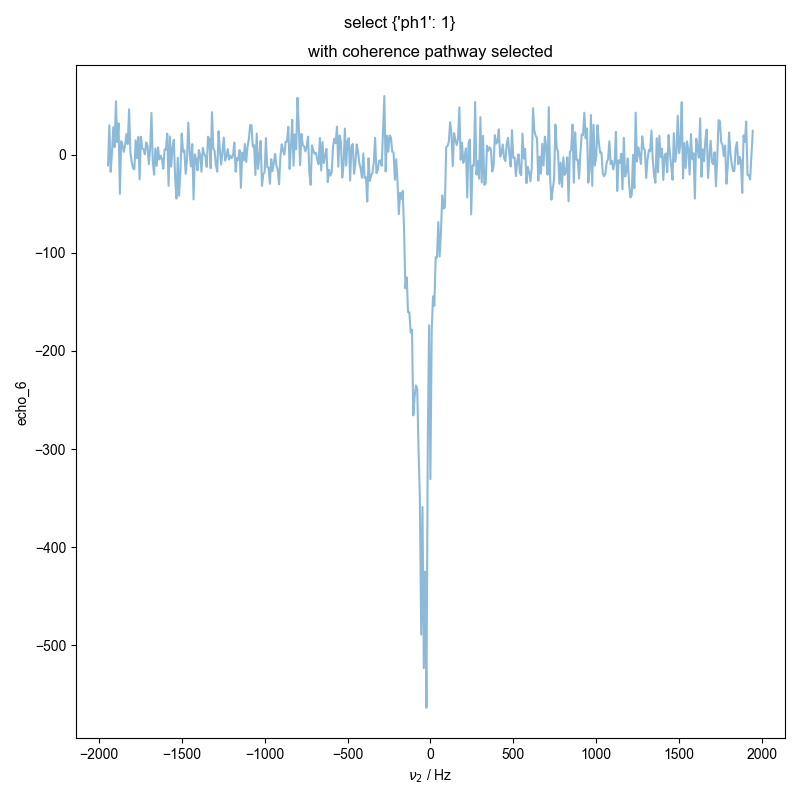
3: with coherence pathway selected |||Hz
import pyspecProcScripts as prscr
import numpy as np
import sys, os
import matplotlib.pyplot as plt
from itertools import cycle
import pyspecdata as psd

if (
    "SPHINX_GALLERY_RUNNING" in os.environ
    and os.environ["SPHINX_GALLERY_RUNNING"] == "True"
):
    sys.argv = [
        sys.argv[0],
        "echo_6",
        "240620_200uM_TEMPOL_pm_echo.h5",
        "ODNP_NMR_comp/Echoes",
    ]

psd.init_logging(level="debug")

colorcyc_list = plt.rcParams["axes.prop_cycle"].by_key()["color"]
colorcyc = cycle(colorcyc_list)

assert len(sys.argv) == 4
d = psd.find_file(
    sys.argv[2],
    exp_type=sys.argv[3],
    expno=sys.argv[1],
    lookup=prscr.lookup_table,
)
print("postproc_type:", d.get_prop("postproc_type"))
with psd.figlist_var() as fl:
    d.squeeze()
    print("=" * 13 + "ACQ PARAMS" + "=" * 13)
    for k, v in d.get_prop("acq_params").items():
        print(f"{k:>25s} : {v}")
    fl.next("raw data")
    print("=" * 36)

    def image_or_plot(d):
        if len(d.dimlabels) == 1:
            fl.plot(d)
        elif len(d.dimlabels) == 2:
            iterdim = d.shape.min()
            if d.shape[iterdim] > 3:
                # so that we can do pcolor, if the indirect is a structured
                # array, just pull the first field
                if d[d.dimlabels[0]].dtype.names is not None:
                    the_field = d[d.dimlabels[0]].dtype.names[0]
                    d[d.dimlabels[0]] = d[d.dimlabels[0]][the_field]
                    if "time" in the_field:
                        d[d.dimlabels[0]] -= d[d.dimlabels[0]][0]
                        d[d.dimlabels[0]] /= 60
                        d.set_units(d.dimlabels[0], "min")
                d.pcolor()
                return
            untfy_axis = d.unitify_axis(iterdim)
            for idx in range(d.shape[iterdim]):
                c = next(colorcyc)
                fl.plot(
                    d[iterdim, idx],
                    label=f"{untfy_axis}={d[iterdim][idx]}",
                    c=c,
                    alpha=0.5,
                    human_units=False,
                )
                fl.plot(
                    d[iterdim, idx].imag,
                    label=f"{untfy_axis}={d[iterdim][idx]}",
                    c=c,
                    alpha=0.1,
                    human_units=False,
                )
        else:
            rows = np.prod([d.shape[j] for j in d.dimlabels[:-1]])
            if rows < 500:
                fl.image(d)
            else:
                fl.image(d, interpolation="bilinear")

    image_or_plot(d)
    if "nScans" in d.dimlabels:
        d.mean("nScans")
        fl.next("signal averaged along nScans")
        image_or_plot(d)
    if d.get_prop("coherence_pathway") is not None:
        fl.next("sum of abs of all coherence pathways (for comparison)")
        forplot = abs(d)
        guess_direct = (
            d.shape.max()
        )  # guess that the longest dimension is the direct
        if guess_direct == "indirect":
            temp = d.shape
            temp.pop("indirect")
            guess_direct = temp.max()
        forplot.mean_all_but(
            list(d.get_prop("coherence_pathway").keys()) + [guess_direct]
        )
        image_or_plot(forplot)
        d = prscr.select_pathway(d, d.get_prop("coherence_pathway"))
        fl.next("with coherence pathway selected")
        image_or_plot(d)
        plt.gcf().suptitle("select " + str(d.get_prop("coherence_pathway")))
Total running time of the script: (0 minutes 1.492 seconds)