Note
Go to the end to download the full example code
Process Enhancement experiment
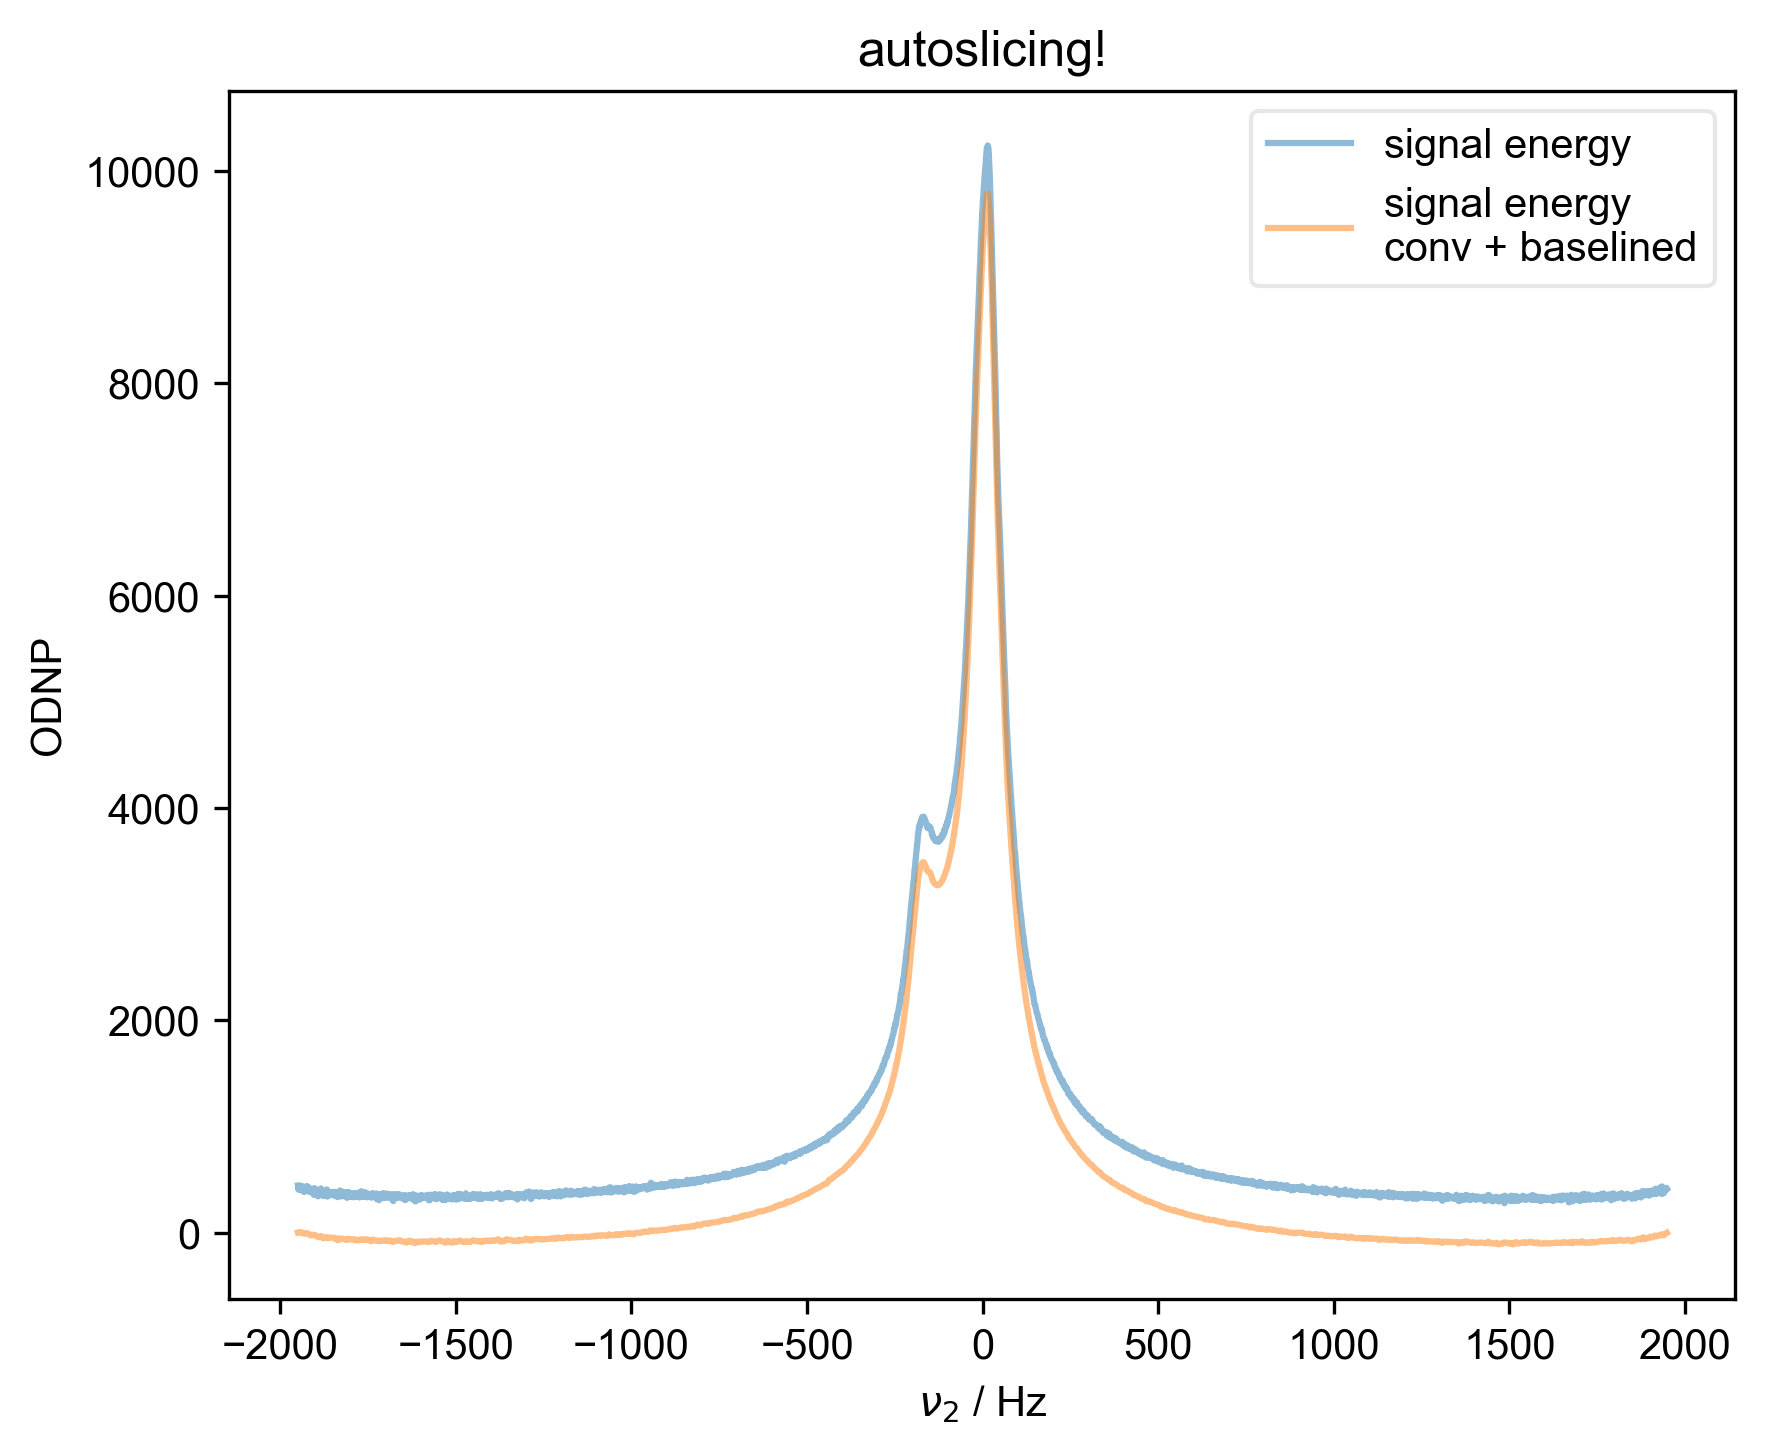
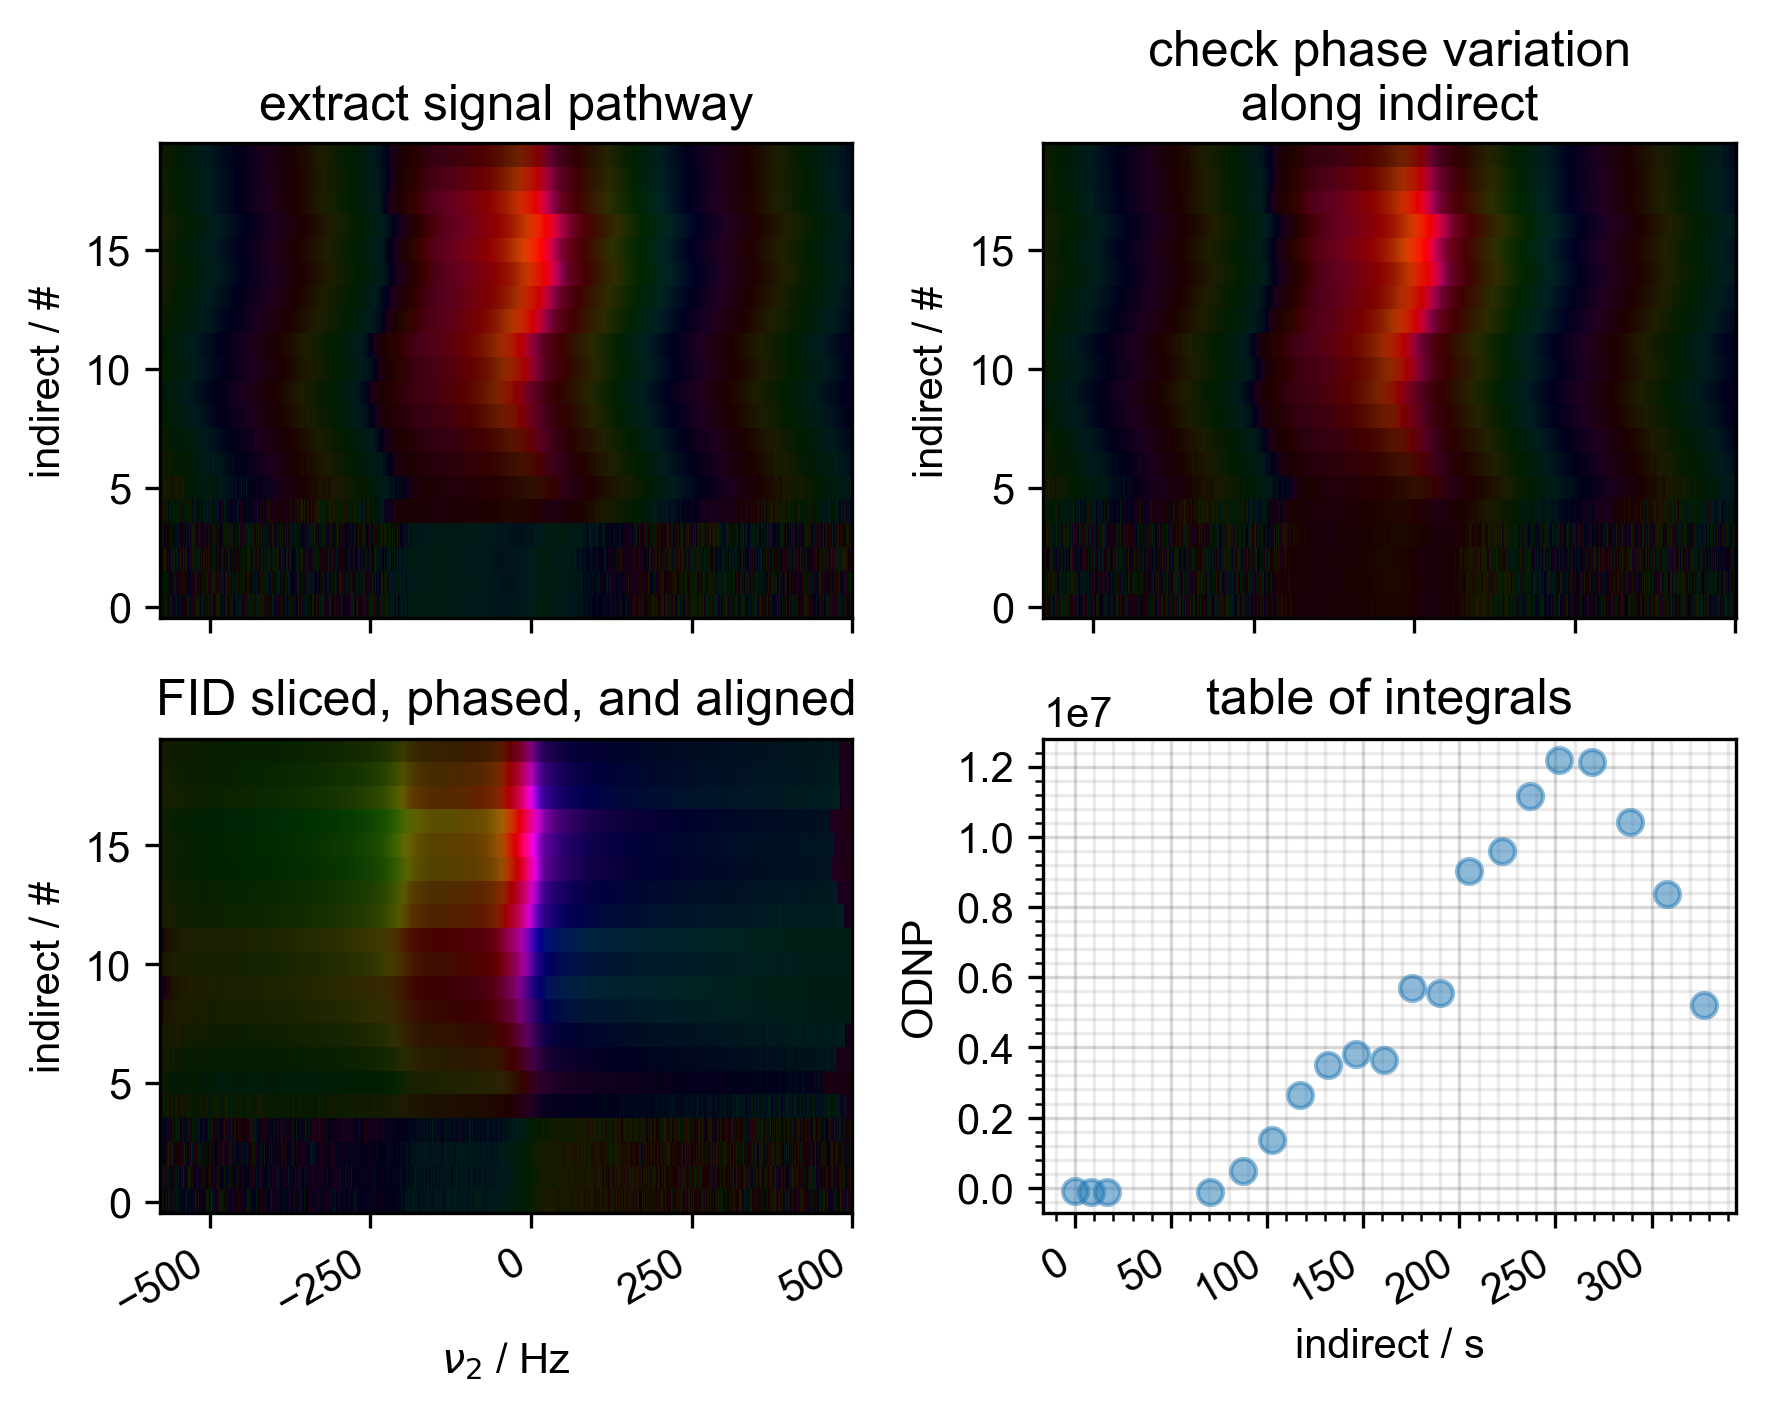
Opens .h5 results file, uses rough_table_of_integrals() to roughly process dataset including generating a table of integrals
You didn't set units for indirect before saving the data!!!
/home/jmfranck/git_repos/pyspecdata/pyspecdata/core.py:8693: RuntimeWarning: invalid value encountered in sqrt
return np.sqrt(arg)
1: autoslicing!
2: Raw Data with averaged scans
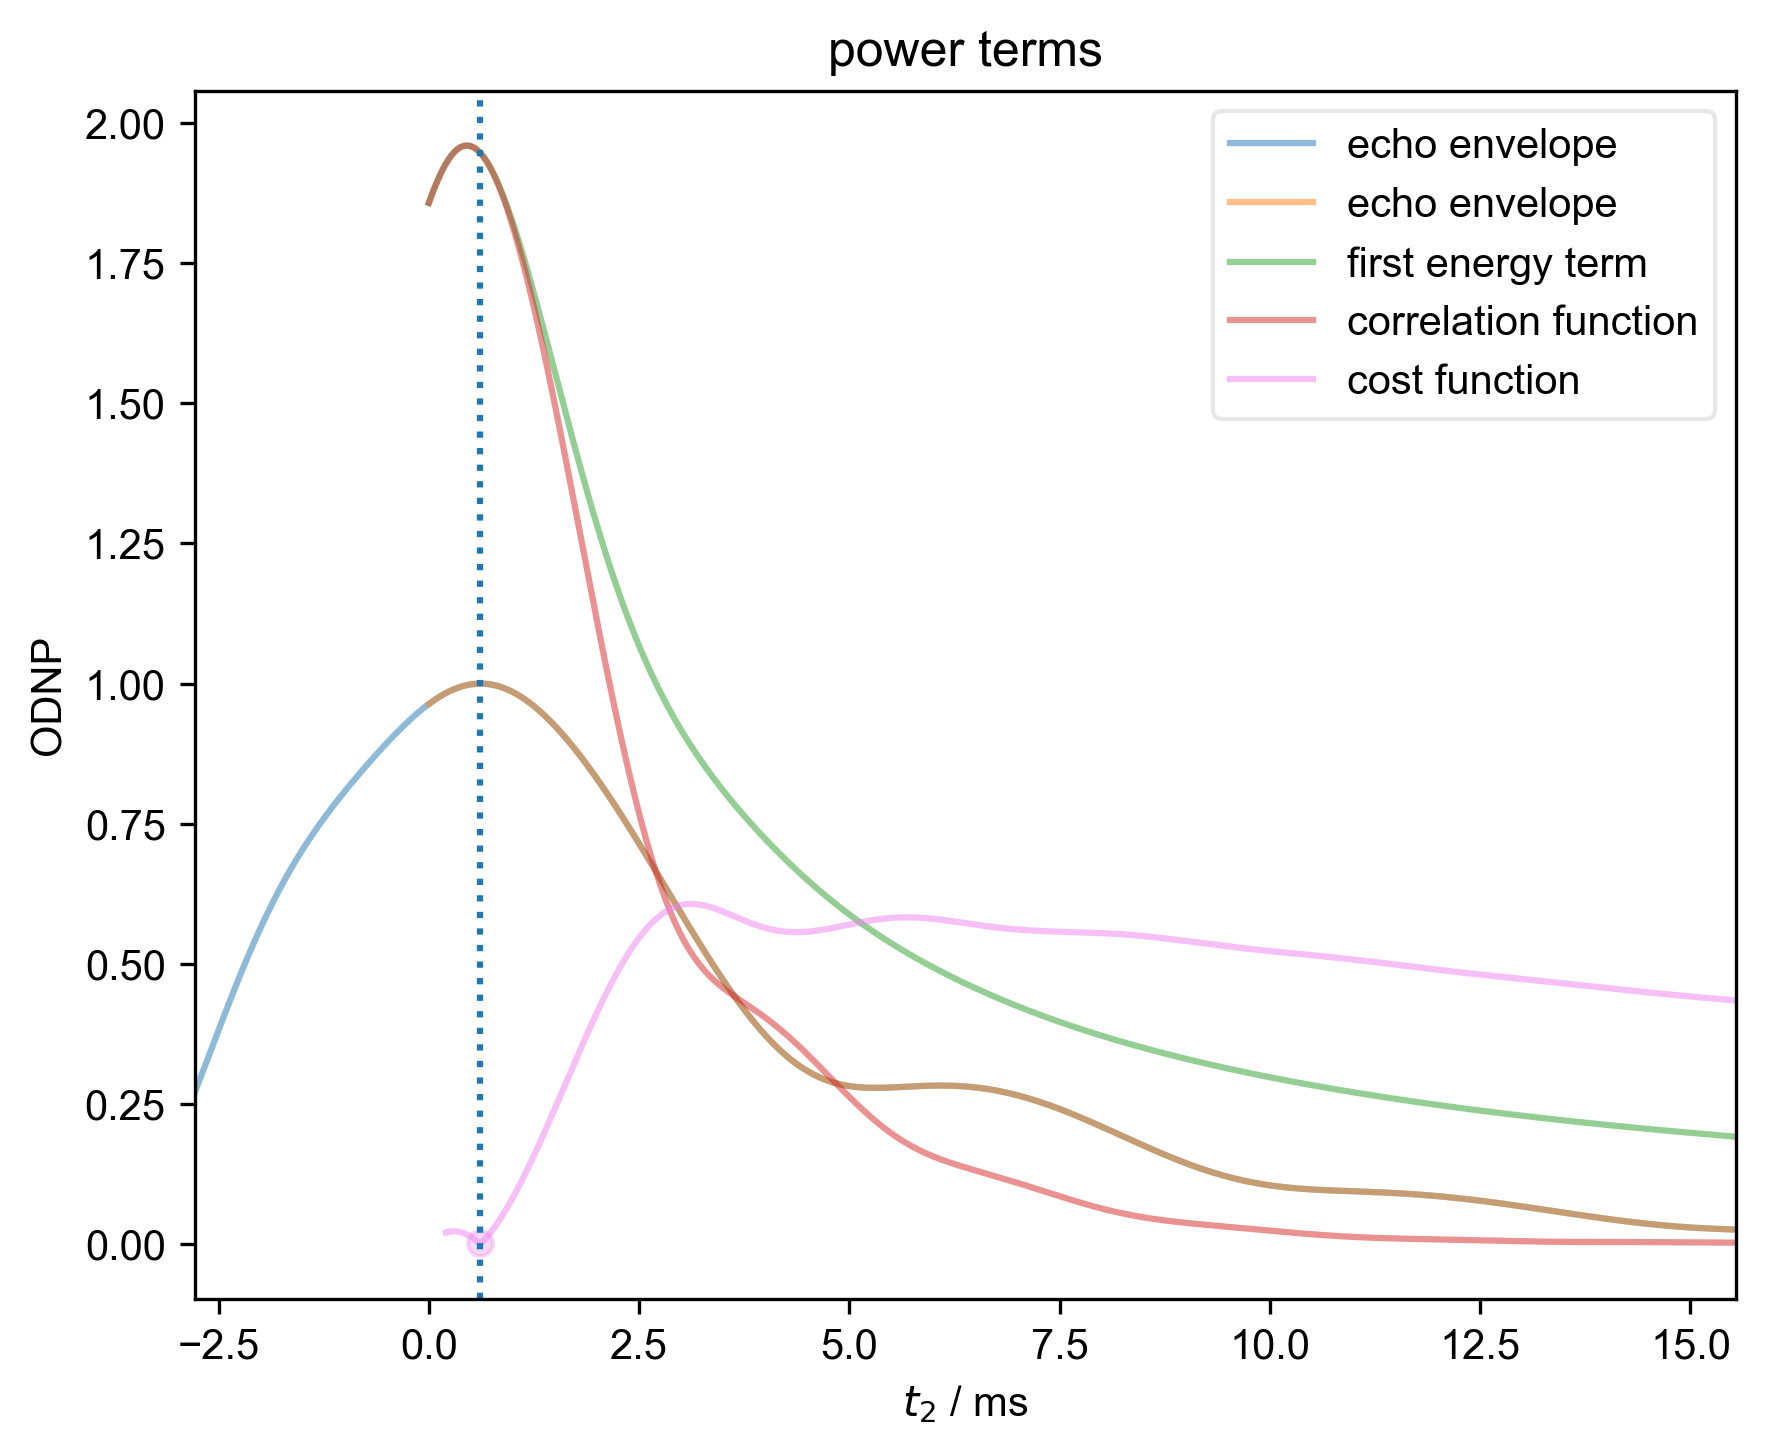
3: power terms |||ms
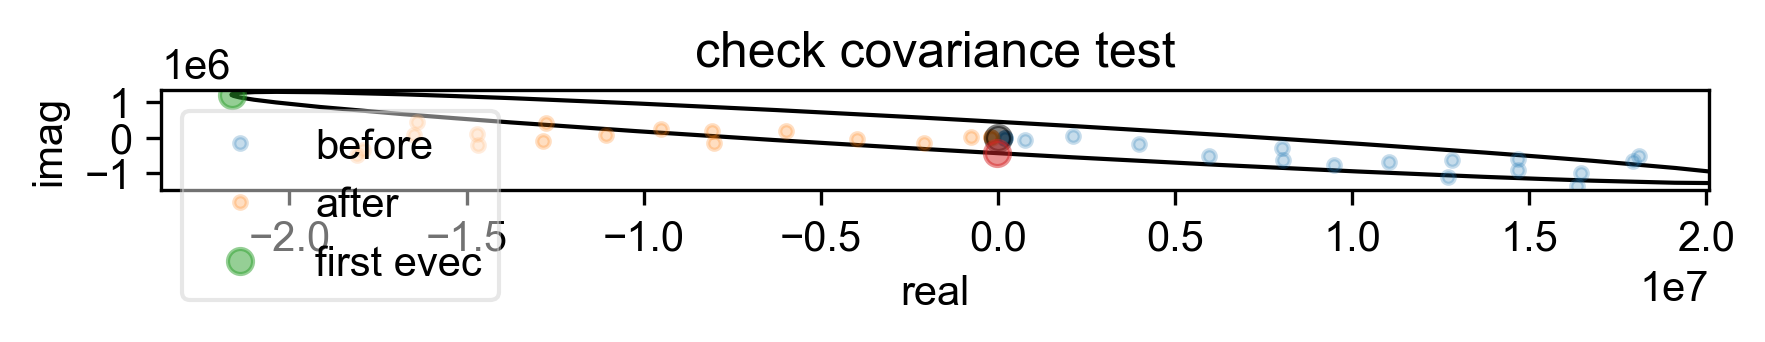
4: check covariance test
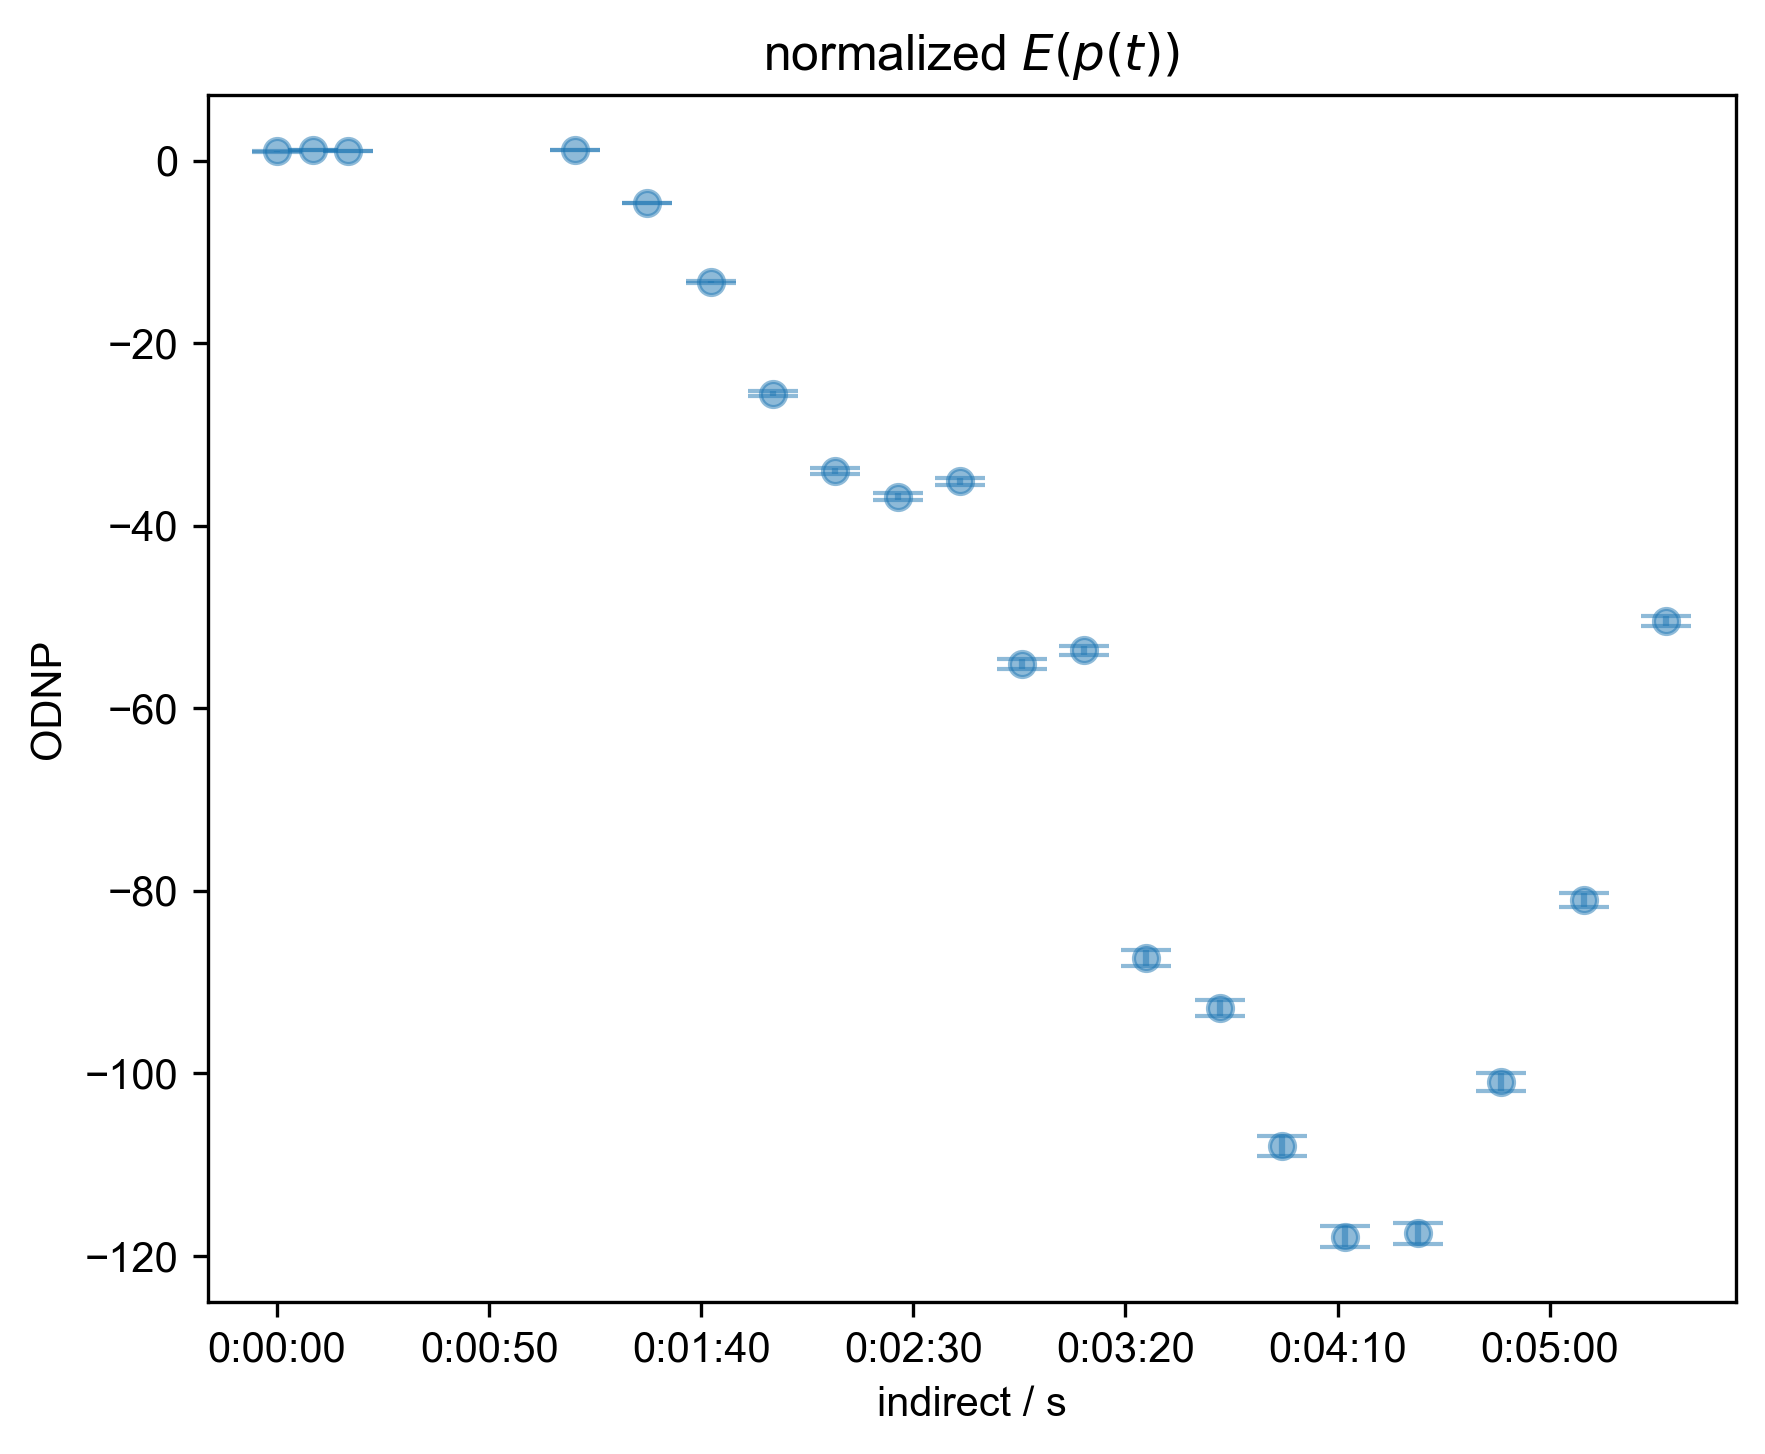
5: normalized $E(p(t))$ |||s
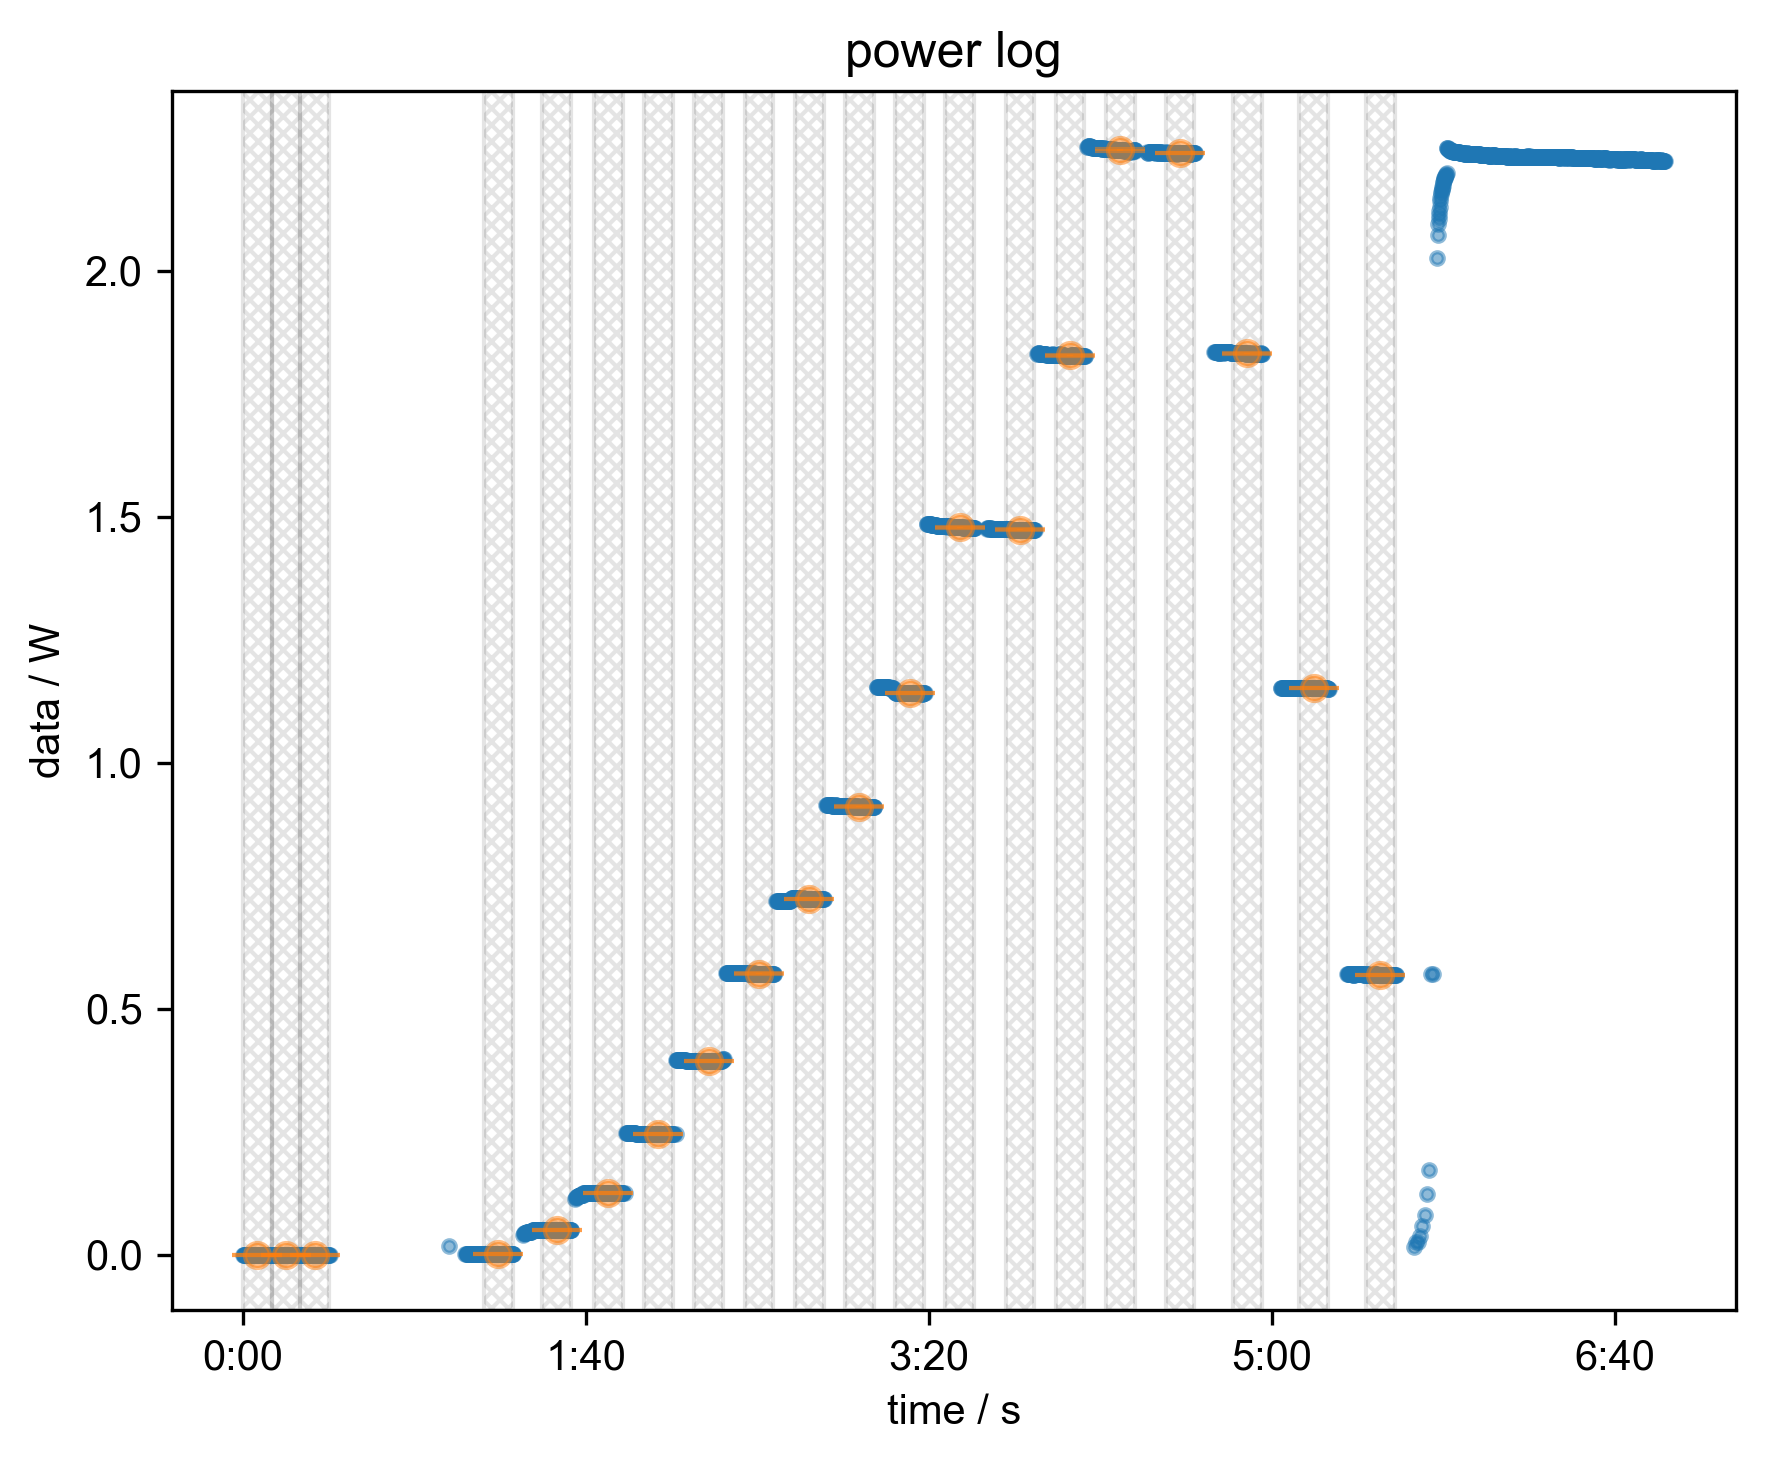
6: power log
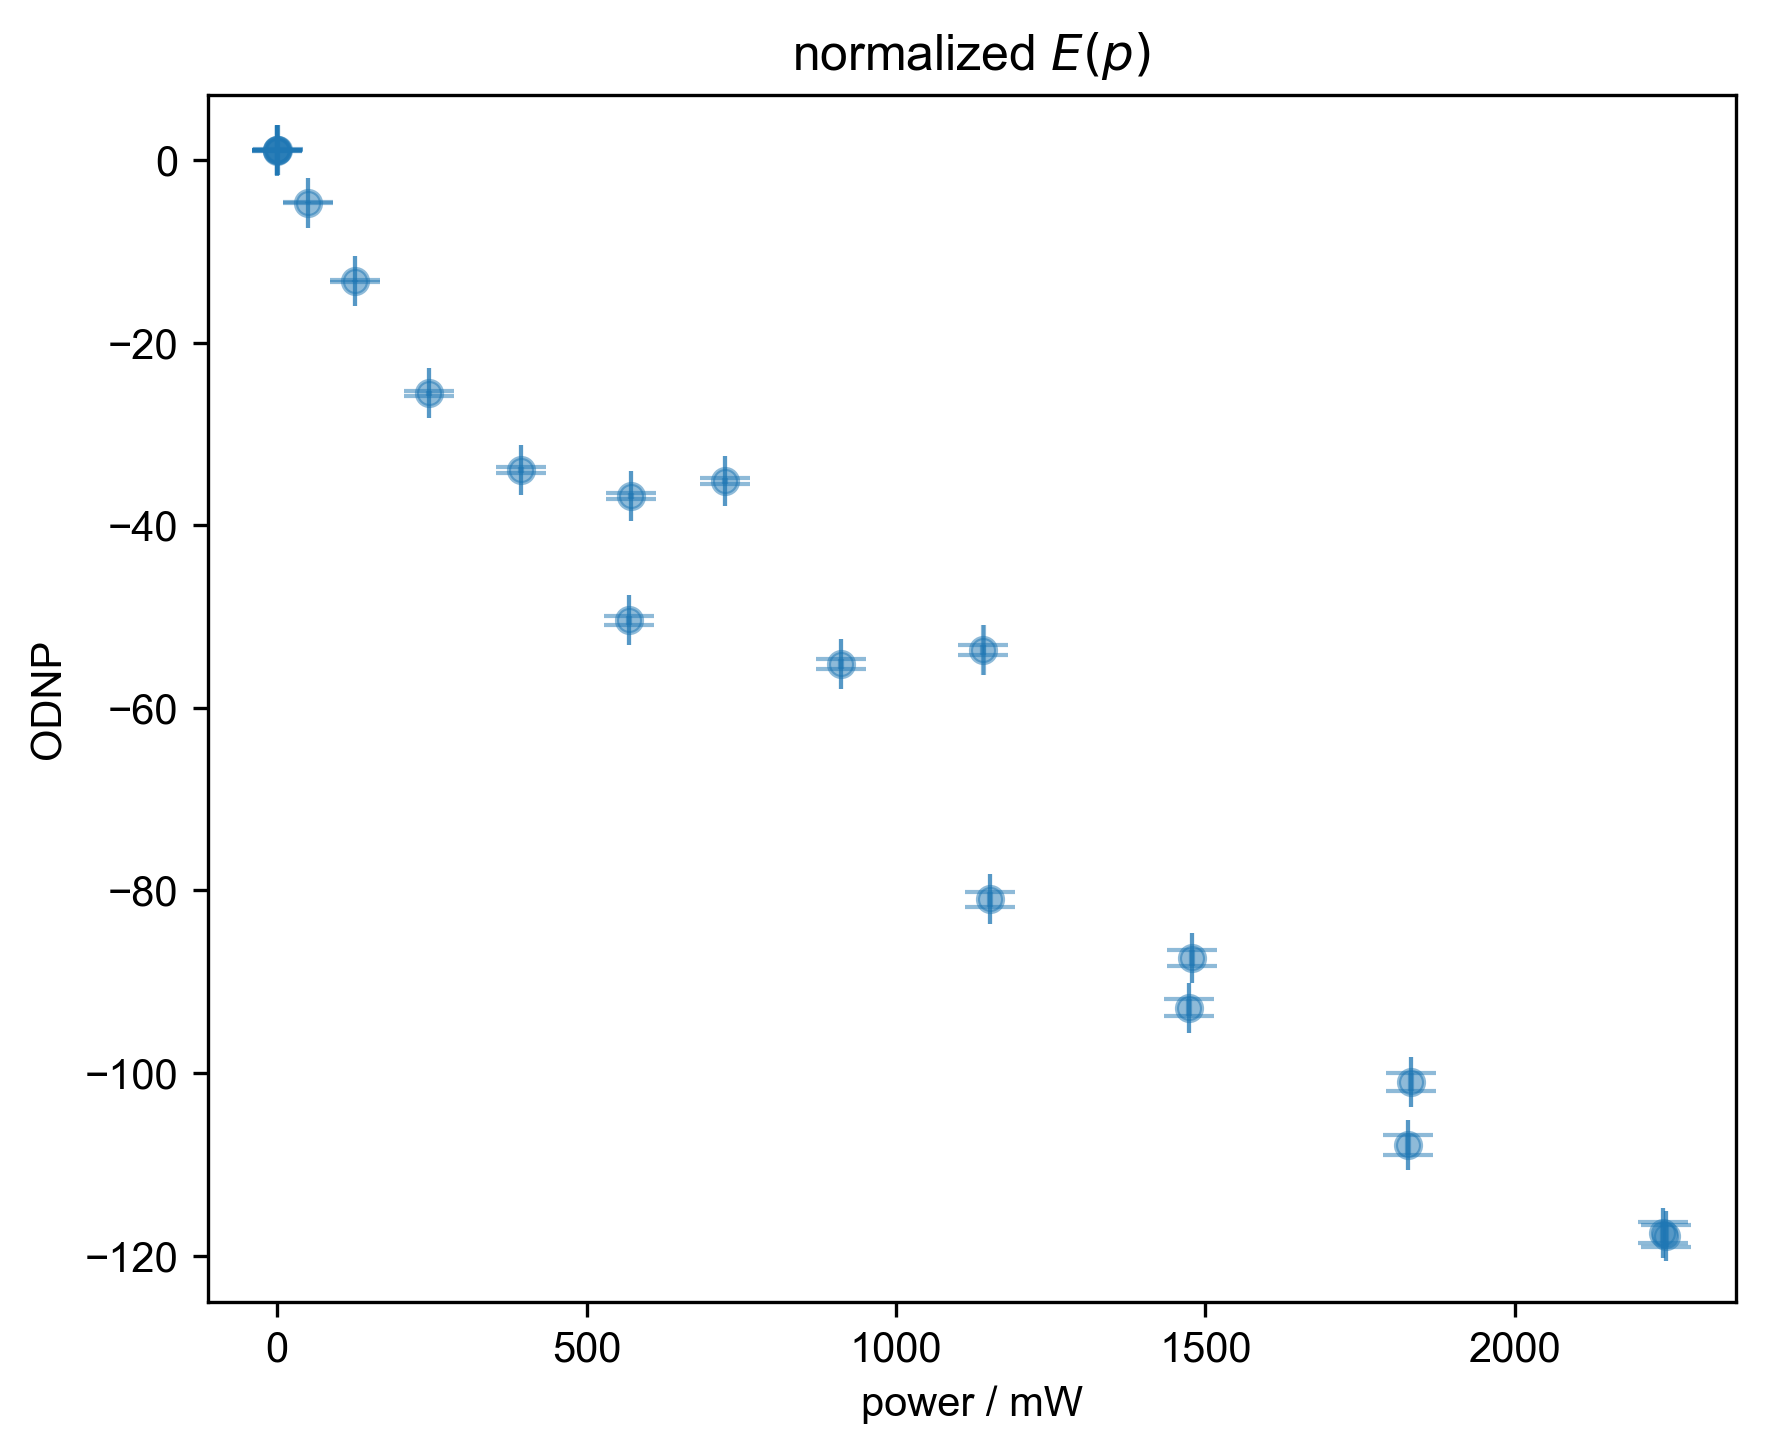
7: normalized $E(p)$ |||mW
import pyspecProcScripts as prscr
import pyspecdata as psd
import datetime
import matplotlib.pyplot as plt

plt.rcParams["image.aspect"] = "auto"  # needed for sphinx gallery
# sphinx_gallery_thumbnail_number = 2
plt.rcParams.update({
    "errorbar.capsize": 2,
    "figure.facecolor": (1.0, 1.0, 1.0, 0.0),  # clear
    "axes.facecolor": (1.0, 1.0, 1.0, 0.9),  # 90% transparent white
    "savefig.facecolor": (1.0, 1.0, 1.0, 0.0),  # clear
    "savefig.bbox": "tight",
    "savefig.dpi": 300,
    "figure.figsize": (6, 5),
})


with psd.figlist_var() as fl:
    thisfile, exptype, nodename = (
        "240924_13p5mM_TEMPOL_ODNP_1.h5",
        "ODNP_NMR_comp/ODNP",
        "ODNP",
    )
    s = psd.find_file(
        thisfile,
        exp_type=exptype,
        expno=nodename,
        lookup=prscr.lookup_table,
    )
    orig_axis = s["indirect"]  # let's save this so we
    #                           can pass it to the log
    s["indirect"] = (
        s["indirect"]["start_times"] - s["indirect"]["start_times"][0]
    )
    s.set_units("indirect", "s")
    s, _ = prscr.rough_table_of_integrals(s, fl=fl)
    assert psd.det_unit_prefactor(s.get_units("indirect")) == 0
    s.set_error(s["indirect", 0].item() * 0.01)  # We are not calculating the
    #                                              errors in rough table of
    #                                              integrals, so just make up a
    #                                              reasonable sized random
    #                                              number so that I can see the
    #                                              relative errors!
    s /= s["indirect", 0:1]
    fl.next("normalized $E(p(t))$")
    s["indirect"] -= s["indirect"][0]
    fl.plot(s, "o")
    # {{{ this is just matplotlib time formatting
    ax = plt.gca()
    ax.xaxis.set_major_formatter(
        plt.FuncFormatter(lambda x, _: str(datetime.timedelta(seconds=x)))
    )
    # }}}
    s["indirect"] = orig_axis
    s = prscr.convert_to_power(s, thisfile, exptype, fl=fl)
    fl.next("normalized $E(p)$")
    fl.plot(s, "o")
Total running time of the script: (0 minutes 5.166 seconds)